 |
|
Oracle Database Signature & Trend Analysis
Oracle Tips by Burleson Consulting |
Originally reproduced from "Oracle
Magazine", and updated 29 March
2007
For
complete details on STATSPACK and AWR in
my latest Oracle book
Oracle Tuning: The Definitive Reference.
Also see
ION for Oracle, a new tool to help automate the analysis of
Oracle STATSPACK and AWR reports.
In order to
accurately tune any Oracle database, you need a
historical data collection mechanism and the ability to
translate the data into reports that show the changes
affecting database performance over time. Oracle's STATSPACK and AWR utilities collect the necessary data along with
the capability of generating trend analysis reports
against the time-series performance tables.
The STATSPACK
utility was first introduced in Oracle8i (release
8.1.6) and was superseded by the AWR in 10g, although you can still use
STATSPACK if you are not licensed for AWR.
How STATSPACK
Works
The STATSPACK
utility is a set of scripts that runs a special version
of the Oracle Begin-Statistics (BSTAT) and End-Statistics
(ESTAT) utilities. These utilities capture elapsed time
statistics for over 100 performance metrics. However,
unlike the BSTAT/ESTAT utilities, STATSPACK captures the
performance data and stores the data in special Oracle
tables.
All of the
STATSPACK tables are owned by the PERFSTAT user, and all
of the tables begin with STATS$. The appendix provides a
complete list of STATSPACK table names
The STATSPACK
Tables
STATS$BG_EVENT_SUMMARY

STATS$BUFFER_POOL

STATS$BUFFER_POOL_STATISTICS

STATS$DATABASE_INSTANCE

STATS$ENQUEUESTAT

STATS$FILESTATXS

STATS$IDLE_EVENT

STATS$LATCH

STATS$LATCH_CHILDREN

STATS$LATCH_MISSES_SUMMARY

STATS$LEVEL_DESCRIPTION

STATS$LIBRARYCACHE

STATS$PARAMETER

STATS$ROLLSTAT

STATS$ROWCACHE_SUMMARY

STATS$SESSION_EVENT

STATS$SESSTAT

STATS$SGASTAT_SUMMARY

STATS$SGAXS

STATS$SNAPSHOT

STATS$SQL_SUMMARY

STATS$STATSPACK_PARAMETER

STATS$SYSSTAT

STATS$SYSTEM_EVENT

STATS$WAITSTAT
|
To see the
columns in these tables, we can simply choose a table
name and use the SQL*Plus 'DESCRIBE' command as shown in
here.
SQL> desc STATS$BUFFER_POOL_STATISTICS;


Name Null? Type

------------------------------- -------- ----

SNAP_ID NOT NULL NUMBER(6)

DBID NOT NULL NUMBER

INSTANCE_NUMBER NOT NULL NUMBER

ID NOT NULL NUMBER

NAME VARCHAR2(20)

SET_MSIZE NUMBER

CNUM_REPL NUMBER

CNUM_WRITE NUMBER

CNUM_SET NUMBER

BUF_GOT NUMBER

SUM_WRITE NUMBER

SUM_SCAN NUMBER

FREE_BUFFER_WAIT NUMBER

WRITE_COMPLETE_WAIT NUMBER

BUFFER_BUSY_WAIT NUMBER

FREE_BUFFER_INSPECTED NUMBER

DIRTY_BUFFERS_INSPECTED NUMBER

DB_BLOCK_CHANGE NUMBER

DB_BLOCK_GETS NUMBER

CONSISTENT_GETS NUMBER

PHYSICAL_READS NUMBER

PHYSICAL_WRITES NUMBER
|
Here we see that
the buffer_pool_statistics contains great information,
including the total physical reads and writes for the
entire database. Once we understand the table structures
we are ready to look at customizing trend reports for
capacity planning. Let's begin with a general discussion
of trend analysis and then look at how these reports are
generated.
Trend Analysis
Using STATSPACK
Oracle only supports a single report
called 'STATSREP.SQL' for STATSPACK and AWRRPT.QL for the 10g AWR. While this is a great report for
viewing the changes between two specific points in time,
it does not provide the data needed to create trend
reports. Experienced DBA's know that measuring
performance data over time can provide great insights
into hourly, daily, and weekly "signatures".
Just like every person has a unique signature, each
database had a unique signature for I/O, sorting, data
buffer hit ratio, and so on. These signatures, in turn,
tell the DBA when specific database tasks are stressing
the database.
You can paste any STATSPACK or AWR
report into
www.statspackanalyzer.com, to get expert analysis of any STATSPACK or AWR report.
The purpose of
time series plotting is to develop signatures for various
database metrics. For example, we might note that our I/O
is always high on Tuesday mornings at 9:00 AM, or that
our data buffer hit ratio always drops low on Wednesday
afternoons. By having this signature information the DBA
can properly plan for the peaks and valleys in the
database performance. Let's explore this concept by
looking at some actual STATSPACK plots.
Total Time
Series Reports
These reports
show the overall trend of the database over a specific
time period. In the example in Figure 1 we see a report
on the total bytes for a database that has been plotted
in MS-Excel with a linear regression line added to show
the database growth rate.
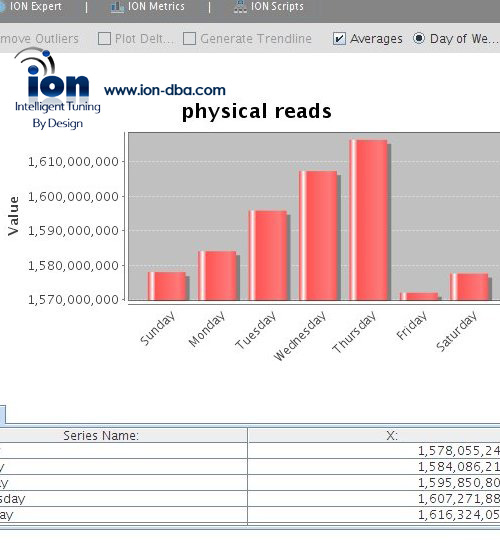
Daily Reports
These show
hourly trends, grouped by hour of day. In the example below we see a signature for average read I/O and
write I/O, averaged by the hour of the day. Here we can
clearly see that this database has a read I/O signature
with a peak at 7:00 AM and again at 8:00 PM. We also see
that this database has a relatively constant write
signature.
Weekly Reports
Below we
see disk sorts averaged by day of week. Here we see a
clear signature where disk sorts are high on Monday, peak
on Tuesdays, high on Wednesdays and decline on Thursdays
and Fridays. This can give the DBAs a heads-up about
potential high impact times for the TEMP tablespace.
Now that we are
convinced about the usefulness of trend reports, let's
examine some of the common metrics that are extracted
from STATSPACK.
So how do we
average by hour or day? Actually it us quite simple.
Consider this script which prints average disk I/O by day
of the week
STATSPACK
Query to Average by 'day of the week'*
set pages 9999;

column reads format 999,999,999

column writes format 999,999,999

select

to_char(snap_time,'day'),

avg(physical_reads) reads,

avg(physical_writes) writes

from

perfstat.stats$buffer_pool_statistics fs,

perfstat.stats$snapshot sn

where

fs.snap_id = sn.snap_id

group by

to_char(snap_time,'day')

;
*To
change this script to 'average by hour of the
day', simply change 'day' to 'HH24'.
|
What STATSPACK
Data is Best for Trend Analysis?
With hundreds of
statistics available in STATSPACK, the question arises as
to what metrics are the most useful?
- Sorts
- It is
important to monitor the amount of sorting in the
database, especially the amount of sorting that
is done in the TEMP tablespace (sorts (disk)).
- Physical
disk reads
- The
reduction of I/O is the primary goal of Oracle
tuning, so a trend report showing hourly disk
reads can be very useful for measuring the effect
of table reorganizations the re-sequence rows
into index order.
- Physical
disk writes
- The amount
of disk writes has a great impact on the overall
throughput of the Oracle database, and is
especially important when rollback segment
activity is critical.
- I/O waits
- This is a
very important metric that can be used to
identify and correct I/O contention. High I/O
waits occur when two or more data files are being
accessed simultaneously and the read-write head
movement of the DASD causes the disk to wait for
the completion of I/O.
- Buffer Busy
Waits
- A buffer
bust wait occurs when a Oracle data block resides
in a buffer, but the requesting program must wait
to retrieve the data block. Buffer Busy Waits can
commonly occur when a table has concurrent
'UPDATE' or 'INSERT DML' and only one freelist is
defined for the table.
- Redo log
space requests
- Redo Log
space requests occur when the log buffer is too
small to hold the volume of redo log activity.
- Latch pin
hit ratio
- The pin hit
ratios for the database instance give a good idea
of the sizing of the shared_pool_size parameter
in the init.ora file.
- Table Fetch
Continued Row
- This metric
give a general indication of database migrated/chained rows. When chaining becomes excessive, additional
I/O is required to service a query, and the DBA
should increase PCTFREE for the table and
reorganize the table to remove the chains.
With an
understanding of the structure of the STATSPACK tables
and a little practice, customized reports can easily be
created.
The Ion tool
is the easiest way to plat STATSPACK data for graphical analysis.
Plotting Graphs
of Oracle Trends Using Spreadsheets
Once the
performance data has been captured, the STATSPACK reports
can be run against the tables to provide capacity
planning and trend analysis. This can also incorporate
linear regression and predictive models so the DBA can
predict when to order more disk memory based on prior
consumption rates.
To give a simple
example, let's take a simple extract and plot it using
the chart wizard in MS-Excel. The steps are:
- 1.
Run the query in SQL*Plus against the
STATSPACK data
- 2.
Cut and paste the result into the
spreadsheet
- 3.
In MS-Excel, with the data you have just
pasted highlighted, choose 'DATA' from
the drop-down menu and then 'Text to
Columns'. This will separate the columns
into distinct cells.
- 4.
Press the chart wizard button and create
a line chart
Here are the
steps in detail:
 |
| Step
One. First we copy the data using <CTRL> C. |
|
| Step
Two. Next we open MS-Excel and paste the data
using <CTRL> V. |
 |
| Step
Three. With our data column highlighted,
choose 'DATA' from the drop-down menu and then
'Text to Columns'. Run the 'Text Wizard' by
fixed-width separation. |
| |
 |
| Step
Four. Next we press the chart wizard button
and choose a line chart. |
 |
| Step
Five. Now we have the graph ready to
complete. |
Now that we have
covered the graphing tools, let's examine a generic alert
script that uses STATSPACK data to automatically alert
the DBA to impending problems.
The Ion tool is the easiest
way to display STATSPACK and AWR data in Oracle and Ion is inexpensive
(starting at $41.95) and allows you to spot hidden STATSPACK trends.
Customized
Exception Alert Reports for the DBA
One of the most
effective reports against the STATSPACK data is the
ability to create out-of-bounds alerts whenever a
statistic exceeds a pre-defined threshold. The script
'alert.sql' in the appendix can be easily scheduled to
run daily and provide the DBA with a report showing all
of the exceeded thresholds.
Here are the
thresholds that are measured by 'ALERT.SQL':
* Buffer hit ratio < 90%

* Redo log space requests > 20/hr

* Disk sorts > 20/hr

* Buffer bus waits > 10/hr

* Table fetch continued rows > 10,000/hr

* High I/O waits > 5,000/hr
|
Some shops also
extend STATSPACK and store UNIX performance metrics for
alert reports. Of
course, the DBA can easily customize the 'ALERT.SQL'
script according to their specific needs. In some shops,
this script is installed and used by management to
monitor the effectiveness of the DBA in keeping the
database running properly.
In shops where
the UNIX server has connectivity to e-mail, the daily
alert reports are mailed to the DBA. This will free up
the DBA from the tedious chore of constant monitoring and
allow them to concentrate on more complex DBA tasks.
 |
If you like Oracle tuning, see the book "Oracle
Tuning: The Definitive Reference", with 950 pages of tuning tips and
scripts.
You can buy it direct from the publisher for 30%-off and get
instant access to the code depot of Oracle tuning scripts. |